
The Complete Trader's Guide: My Process, Tools, Routine, Core Beliefs & FAQs — Fully Detailed
15 Years of Market Insights. A few quick, simple refinements to your process can significantly shift your equity curve and enhance long term compounding.

Some of you may have noticed I took down my 16-year website late last year. The goal was to reduce my digital footprint, stay compliant with regulations (if required), start assembling my small-scale asset management team, and keep a lower profile—which is also why I’ve politely declined interviews in recent years. I don’t sell courses/services, and my fund is a closed-end vehicle that reports only to one party on a performance-fee basis. Publicity and AUM growth aren’t priorities for me, and shouldn't be one for a trader. That said, my Substack—despite being inactive for two years—has grown to over 10k subscribers. I’m here repurposing it as a content hub: archiving my long-form twitter threads into short links for easy reference, and adding an FAQ plus a glossary for terms I often use (e.g., T+3, VARS, RVoL, XxATR% from 50-MA), and keep the content free and accessible. I also came across another website that published a summary of my process in 2023.
https://qullamaggie.net/jeff-suns-method-and-flow/
That said, I remain active on Twitter, LinkedIn, and Instagram. This space serves as a central FAQ reference and will be continually updated and expanded over time. If any of my content has been helpful, you’re welcome to pledge a gift subscription, buy me a coffee, or subscribe to my Twitter/X for my direct trade ideas and curated market commentary.
Content Page
Glossary – Terms and Expressions I Use
Charting – My Approach Using TradingView
My Screeners – Workflow of Finviz & Tradingview
Process & Routine – Moving Ideas to the Focus List
Pre-Market Routine – Situational Awareness
Proficient Execution– Trade Design, Stops, % Risk
Post-Execution – Trade Management
Journaling – Fine-Tuning to Improve YoY % Return
Conviction – Internalizing These 6 Graphics
Full-Time Trading – What Does It Takes
Five Books I Highly Recommend To Everyone
Free Productivity Tools & Websites I Rely On
How I Delayed My Own Progress by 3 Years
Reflections and Experiences for You to Relate To
Closing Remarks – A Call to Inspiration
FAQ, Paired with Thought-Provoking Questions
Subtle Strategies to Attract Institutional Attention
Chapter 1. Glossary of Terms and Expressions I Often Use in my Twitter Commentary
LoD: Low of intraday price action at the time
RVOL: Relative volume compared to the average (typically 50-Day sessions)
T+3: T = execution day; +1 = Day 1 after execution; +3 = Day 3 after execution. ‘Day' does not include weekends or market holiday.
VARW: Volatility Adjusted Relative Weakness
ORH: Intraday opening range high at the time
R: “I closed the trade on +16R” etc. The “R” in R-Multiple represents the initial risk on a trade, defined by the difference between the entry price and the stop-loss level. An R-Multiple then expresses the profit or loss of a trade as a multiple of this initial “R” amount, allowing traders to objectively evaluate performance by focusing on the quality of trades relative to the risk taken
M30 Re-ORH: Post-open 30 minutes reclaim of the intraday opening range high
X × ATR% from 50-MA: X ATR% multiple extension from the 50-day moving average.
ATR: Average True Range, & ADR: Average Daily Range, and their differences
VCP: Volatility Contraction Pattern, popularized by Mark Minervini. To upgrade a watchlist stock into actionable focus list will require some form of VCP in price, or both price & volume. Every sustainable price expansion rally will always be preceded by a phase of price contraction/tightening. I will NEVER enter a stock with prior loose price action.
PEAD: Post-Earnings Announcement Drift: is a well-documented market anomaly where stock prices continue to drift in the direction of an earnings surprise for some time following the announcement. This provides traders with an opportunity to exploit the delayed response of the market to new earnings information.
Chapter 2. Charting - My Approach Using Tradingview
My Templates, Indicators that I used, and how to utilize them:
2023 Version: https://x.com/jfsrev/status/1649333754215948290
2024 Version: https://x.com/jfsrev/status/1818297619338395847
2025 Version: Free indicators that have remained consistent pillars; (Direct Link to their Tradingview scripts, and explanation thread below)
1) Swing Data - ADR% / RVol / PVol / Float % / Avg $ Vol - Over 75k Users
https://www.tradingview.com/v/uloAa2EI/
Bonus: Video demonstration of the indicator on the Mobile App
1. Understanding of ADR%
a) ADR%: Examining Trend-Following vs. Range- Expansive Move Behavior
b) Understanding the Benefits of High ADR% Securities Relative to your Position Sizing
e) Here is where I get my full leveraged ETF list, and update them on monthly basis
2. Understanding of LoD distance of ATR
b) Perks of <60% LoD Execution
c) This is why you should trade tight
3. Understanding of RVOL (Relative Volume)
b) RVOL based entry on ORH have proven statistical edge in the market
c) RVOL based entry rules have saved me from countless unnecessary stop losses year after year
d) Adam H. Grimes explains the concept of RVOL in 2015 better than anyone else
e) Honored that Adam H. Grimes wrote a piece on RVOL in 2025 after my tweet caught his attention.
4. Understanding Average $ Volume and Average Share Volume
a) Slippage and widen spreads at execution have cost me 6-7% of my 2021 total equity
5. Understanding of Market Cap, Low Float %, Short Float
a) The best % performers almost always have these three ingredients.
b) I pulled all top 100% performers from 2018 to 2024 for you to study
2) ATR% multiple from 50-MA - Over 47k Users
https://www.tradingview.com/script/oimVgV7e-ATR-multiple-from-50-MA/
1. Understanding ATR-Defined Volatility Extensions of Stock Prices in Relation to the 50-Day Moving Average
a) One core trading philosophy is all it takes to make your first million from swing trading
b) How can stock price extension be quantified objectively?
c) My favorite indicator for partial profit taking into strength
d) Advantage of utilizing ATR% extension for scaling out profits
e) Employing 6-7 x ATR% multiple from 50-MA for Indexes
f) 10x ATR% compression can unfold at higher prices without any pullback ($LIF)
g) This is what happened to LIF after 10 weeks, without hindsight
i) ATR% Multiple to MA Accounts For Volatility vs % Extension From MA
2. Another great ATR% indicator to investigate historical multiple from 50-MA by Will Hu
3. ATR% Band indicator for projection of multiple from 50-MA by Cotton Dog (f/k/a Goosifer)
a) Useful for projection of ATR% multiple from current share price
3) Volatility Adjusted Relative Strength (VARS) with Histogram Version, first inspired by mattishenner (reddit) - Over 5k Users
1. Understanding VARS vs Traditional RS
a) It began as an idea to enhance the accuracy of traditional RS by factoring volatility that is unique to each different stock/securities, until I found a 2023 reddit thread with similar discussion by Matt.
b) My VARS settings for the indicator as a swing trader
c) I published my own VARS with histogram - October 2025
2. If you want old school, I highly recommend IBD RS Indicator by @Fred6724
4) Simple Volume with Pocket Pivots by @finallynitin
https://www.tradingview.com/script/JkB0iCFp-Simple-Volume-with-Pocket-Pivots/
I’ve tried many great free volume scripts on TradingView, but this one is simple and has everything I need. Here is the full script introduction written by himself in 2022
1. Understanding Volume
5) Worthy Mentions
The below indicators are applied on a separate template, not my main daily one.
a) EPS & Sales @Fred6724
b) Industry Group Strength by @amphtrading , hyperlink here is the discussion of how i use it
c) I wrote an overall piece on the best free 8 Tradingview Public Script in 2024
d) TradingView Seasonality Table - 2025
PS: On a fun note, I relied on something like this back in 2000s
Chapter 3. My Screeners - Workflow: Finviz Post Market & TradingView Pre-/Live-Market RVOL

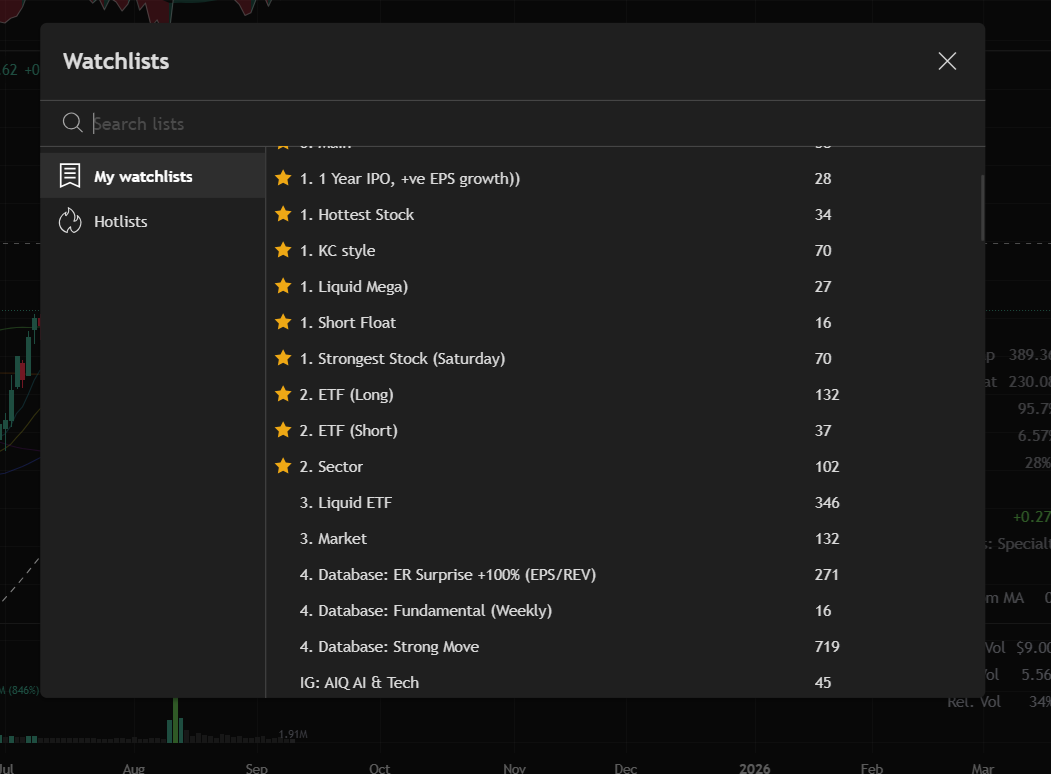
1) I have 14 screeners for post-market analysis, shifting their results into dedicated watchlists by purpose.
Do read this discussion beforehand—it will give you perspective on the dedication necessary despite having these tools.
Bonus: Screening & Watchlist Management — A Commonly Misunderstood Skill for New Traders
CANSLIM-inspired calibrated screener – Over 1.9 million Twitter impressions, making it one of the most popular in my sharing.
b) Finviz Version (2025) - Leveraging it now for the ‘Institutional Transaction’ filter.
High ADR% Hottest Stock screener
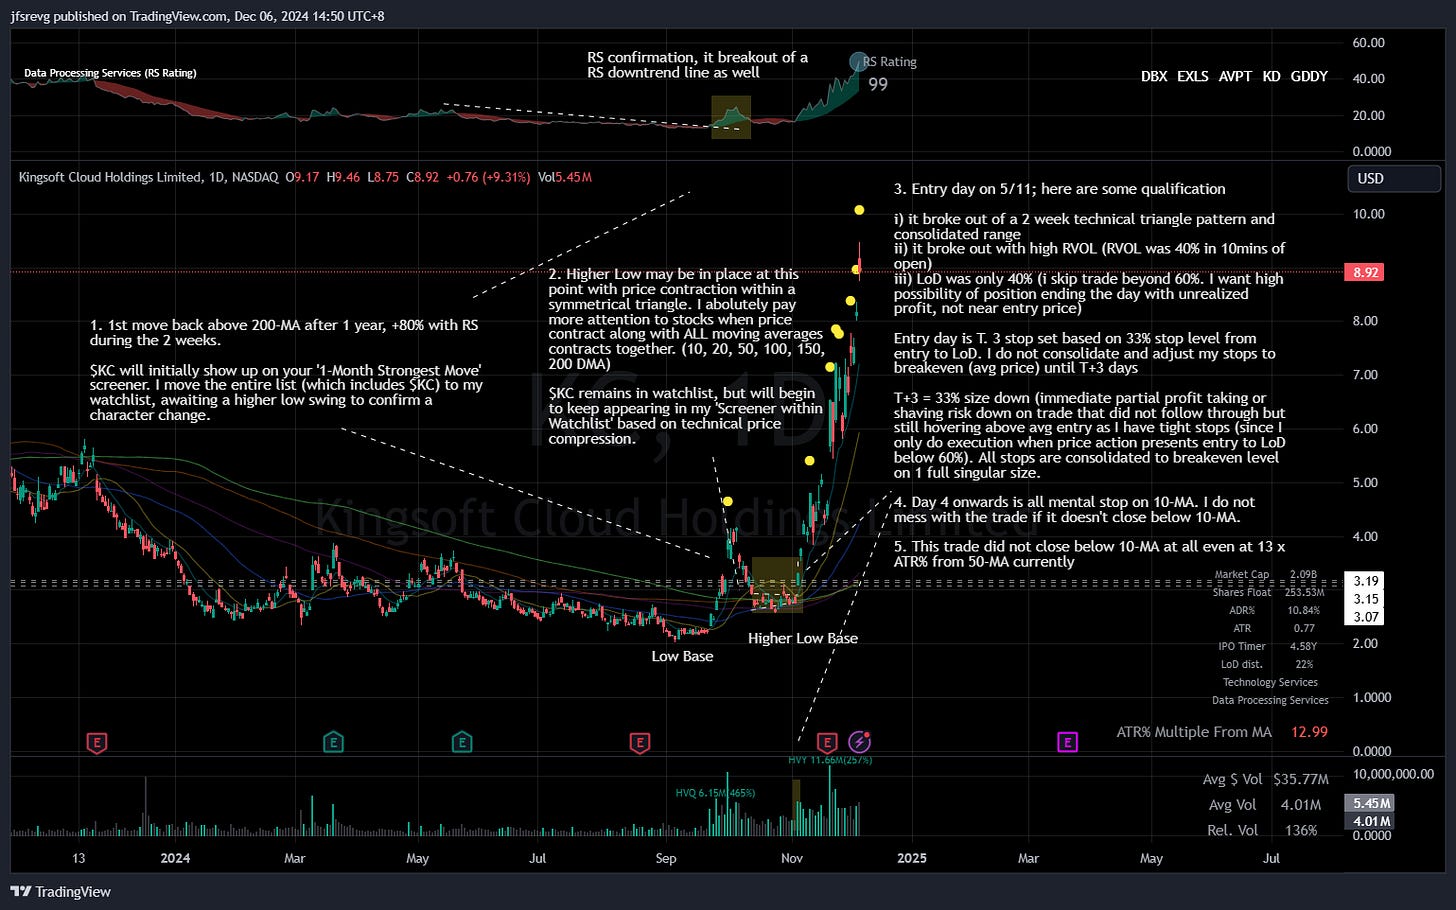
My 2024 +180% KC trade inspired screener - Extended bases and prolonged consolidations, such as Cup & Handle patterns.
Strongest Mover screener - 1-Week, 1-Month, 3-Month, 6-Month
c) Perks of the Finviz mobile web screener: effortless to use at work or on breaks
IPO screener (Screen Frequency: Weekly)
a) Finviz Version (Only Finviz filtering parameter is capable to do this)
High Short Float screener (Screen Frequency: Weekly)
a) Finviz Version (only Finviz filtering parameter is capable to do this)
Liquid ETF screener (I also often trade outside of US-listed equities)
Screen within Screen (Watchlist)
I also have a fixed watchlist of Liquid Mega Cap names (Exceeding $1B average dollar volume on constant) I listed their synthetic leveraged ETFs if you want higher ADR% opportunities in them
A Finviz API Hack To Copy All Screen Result Into TradingView Watchlist by @erikcarell
BONUS: Julian Komar's Strongest Stock Scan in both Tradingview and Finviz
BONUS: Tracking Relative Volume of Watchlist on Tradingview (Similar To TC2000 Volume Buzz)
2) I have 2 live market screeners for high RVOL based execution on Tradingview

This is 2025 update to relocation of screener based on our feedback in 2024
This is the setup of my mainframe for live market trading with RVOL monitoring
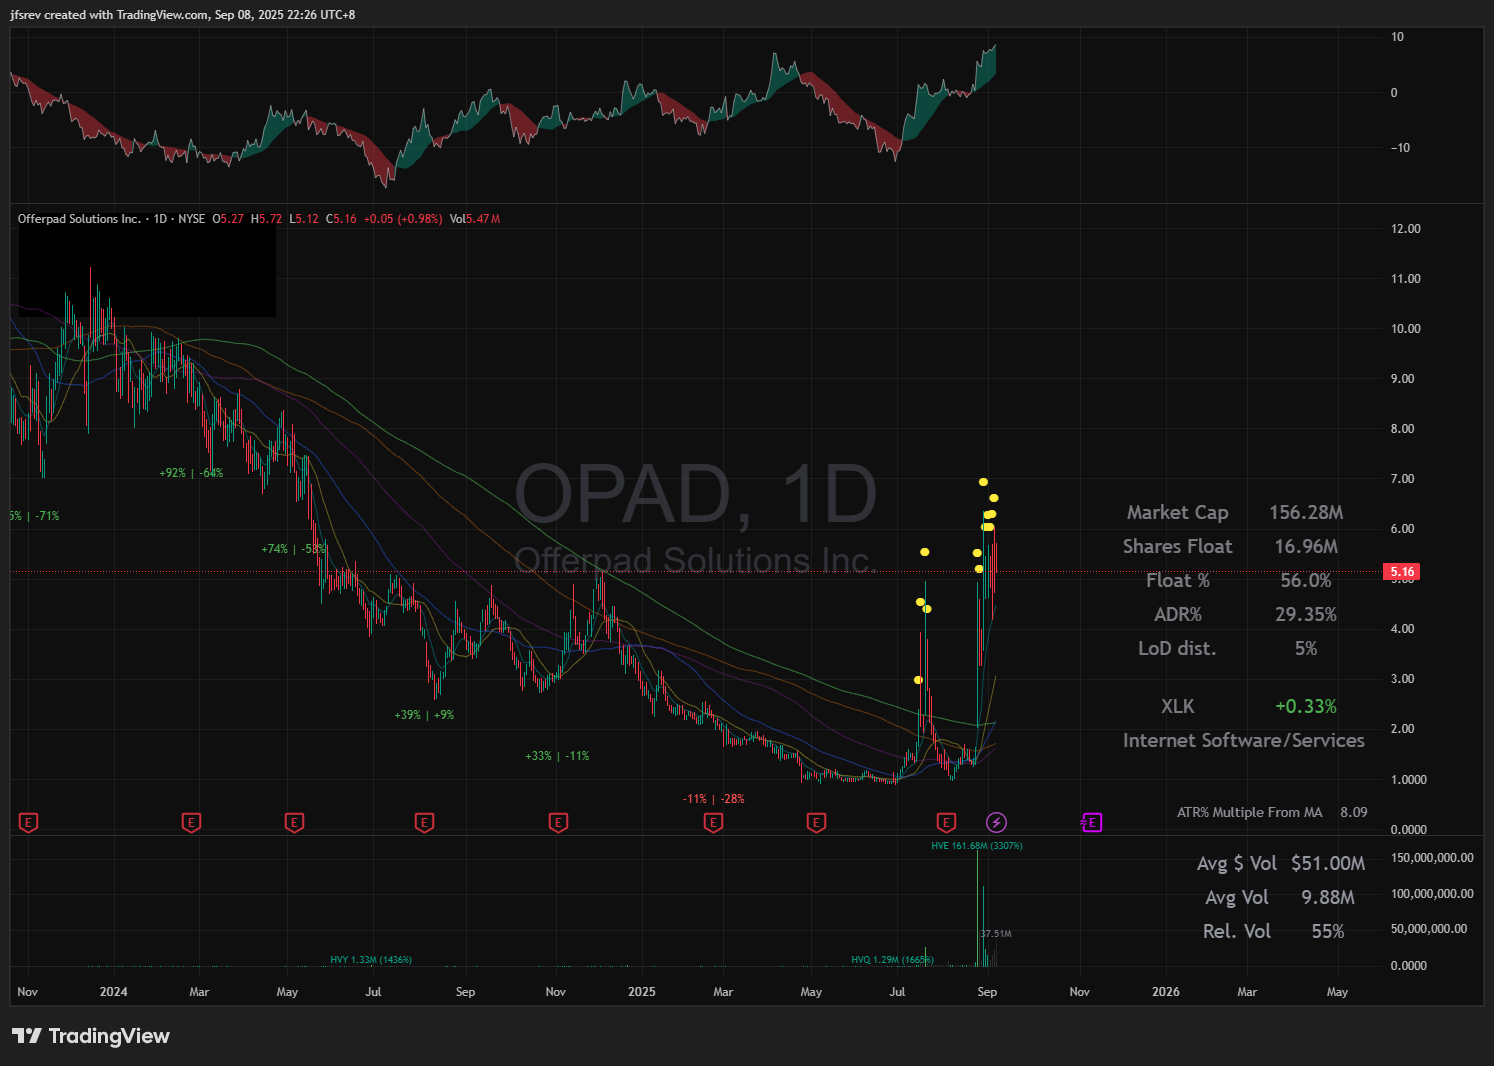
An example of High RVOL I am seeking at open, KOSS on 3rd July 2024
Chapter 4. Upgrading Watch-listed Stock to Focus List, Process, & Routine
My post market daily process flows like this:
Screening → Watchlist Management → Focus List Preparation → Situational Awareness from Qualitative Market Reading → Portfolio Stops Management (if required)
My Daily Process Workflow
a) Screening only builds a generic watchlist
b) Actionable ideas only come after watchlist management
e) An additional ‘Back Watchlist’ for ideas to calibrate screeners
What Qualifies My Focus List
a) A summary written in 2023 - Part 1
b) A summary written in 2023 - Part 2
c) A summary written in 2023 - Part 3 (sub-heading in post should be
Stalk ListFocus List)d) Further discussion of upgrading stock to Focus List
e) My Rule: Relative Strength First, Setup Second (Also, Quallamaggie True Focus is always Relative Strength)
jj) 14th November 2025, After (End of Day)
h) This is how tight Quallamaggie traded RGTI on 9th September 2025 from my focus list
When Market Volatility Picks Up, Stay Highly Active in Managing your Watchlist
a) Focus List Educational Thread on 22nd August 2025
b) Focus List & Portfolio Update on 23rd August 2025 - A showcase of how quick Focus List evolves
f) I’ve limited my daily focus list sharing to Twitter/X subscribers only since mid October 2025 due to flood of spam bots.
g) How I utilize my liquid mega watchlist to streamline opportunities within it
i) Example of short on AMZN (via AMZD long)
i) Another caveat on executing US listed crypto ETFs on Friday session
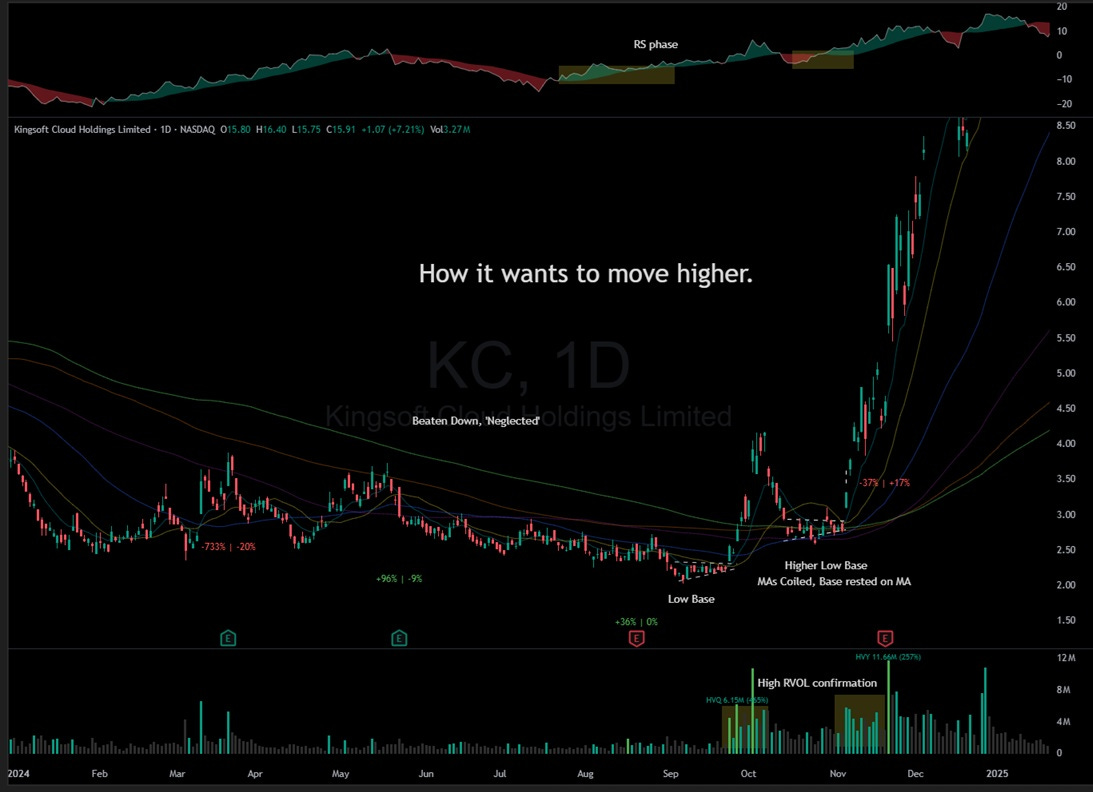
Internalize This Chart — it’s even my screensaver. It outlines the key ingredients for how a stock sets up to move exponentially higher.
a) Simplified Version
b) Expanded Version (But with traditional RS indicator)


PS: Ultimately, I only seek to trade ‘A-Rated’ idea strictly.
Chapter 5. From Post-Market Focus List to Pre-Market Routine, & Situational Awareness
The importance of a daily routine lies in being time-efficient, manageable, and sustainable for long-term trading longevity — it cannot be exhausting.
The lower the timeframe, the greater the commitment it demands from you.

Price Alert (I use TradingView)
a) Setting of Price Alerts is a Pre-Market Ritual
b) Price Alerts can give you a feel of the market
c) Explanation and walkthrough of Tradingview Price Alert by Tradingview

Pre-Market Routine
a) A Routine I Shared Briefly in 2023
b) An Elaboration With 4 Tools I Used 30-Mins Before Open
c) If You Trade/Chase Earnings, Do Understand The Six Outcome Of Its EOD Price Action Post Earnings

Situational Awareness Can Be Objective
a) The most straightforward breadth indicator by Quallamaggie
i) I highlighted on potential further weakness on 21st March 2025
ii) then, I short the market on 28th March 2025, on this simple MA principle
b) Tradingview End of Day Breadth Level Panel
i) Tradingview Breadth Symbols for birdeye view
ii) How do i use Tradingview Breadth Symbols
iii) An example using MMTW (% of Stocks above 20-MA)
iv) Breadth in March 2025 confirm the market isn’t as oversold as expected
c) Tradingview Short Term NH/NL (New Highs - New Lows of 52 Weeks Level)
d) Top Down Approach 1: Using Equal Weighted Market Index Relative to Cap Weighted Index (RSP vs SPY)
i) Top Down Approach 2: Investigation into Sub-Market Level
ii) Top Down Approach 3: Investigation into Sectoral Level
iii) Top Down Approach 3.1: 5 Key Sectors For Breakout Opportunities
iv) Top Down Approach 4: Investigation into Industry Group Level
v) Top Down Approach 4.1: Stanley Druckenmiller’s Indicator, Homebuilders
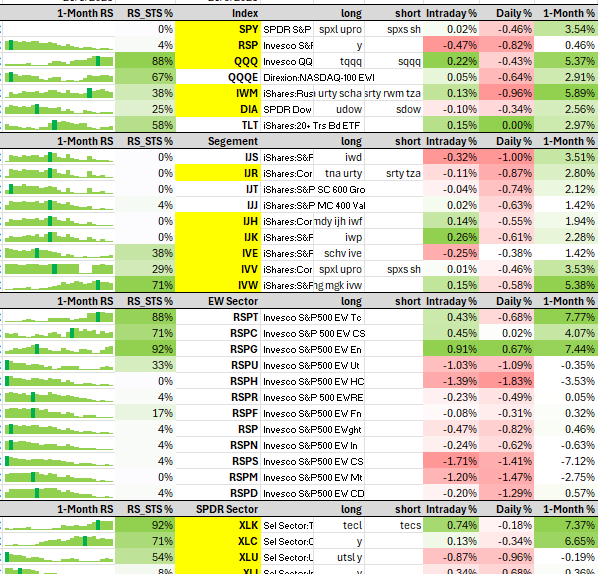
vi) Top Down Approach BONUS: Spreadsheet Tutorial for Creating Your Own FREE Relative Strength Histogram (Both Stock and ETF), that Updates Daily After Close.
vii) Further Tweak by Dr Yong Yang, introducing ‘RS_STS%’ to my Spreadsheet
viii) Example use case for a bird’s-eye view of the live market using the sheet
ix) Free Google Sheet Version by @RonakSh92987573
x) Top Down Approach: Equal Weight ETFs List
xi) Top Down Approach: Full ETF List (Including Cap Weighted)
e) Using Historical ATR% Multiple from 50-MA on Index as Extension Signal
i) Another example in March 2024 before a 2 weeks sell off
f) Using Historical ATR% Multiple from 50-MA on Index as Oversold Signal
i) And I went long on 7th April 2025, right at the bottom of the market
ii) Detailed breakdown of my April 7th long, following strong pushback on Twitter

h) How many hours do I spend daily?


Chapter 6. Design of Entry, Stop, % Risk to Equity, for Proficient Trade Execution
An astounding trading idea, when it comes up for execution in the live market, must be reassessed by its risk-to-reward potential based on the price action at that moment.

Importance of Execution Quality, A-Rated Setup can Result in C-Rated Execution
1) Hard rule: I do not enter trade if LoD already exceeds 60% ATR - Visualizing ATR as Spring Coil
a) Read more about Biotech gap risk
4) Hard rule: I do not enter trade if there’s no substantial RVOL stocks outside of mega cap liquid watchlist and liquid ETFs - because price always fades outside of RVOL
5) Hard rule: I often delay my entry tactics by 30 mins post open, unless extreme high RVOL surface
7) Hard rule: I will not enter a trade against its declining 200-MA because this always happen.
8) Hard rule: I will not enter a trade into an immediate gap resistance zone
10) Hard rule: I never chase, even if I’m just a day late—I only enter at the most optimal entry. - Missing trades won’t make you go broke, chasing them often will.
11) Hard rule: The more the market rises over consecutive days, the more cautious I become about taking long positions.
13) Hard rule: I am extremely cautious with layering further risk exposure when market is poised to open with a gap up. - Reason
14) Hard rule: I will always ‘long’' ideas, even my short ideas on weakness are based on available inverse long synthetic ETFs.
15) Hard rule: Since I prefer to keep this from being widely adopted, this strict execution rule #15 is shared exclusively with my Twitter/X subscribers and described in my daily Focus List.
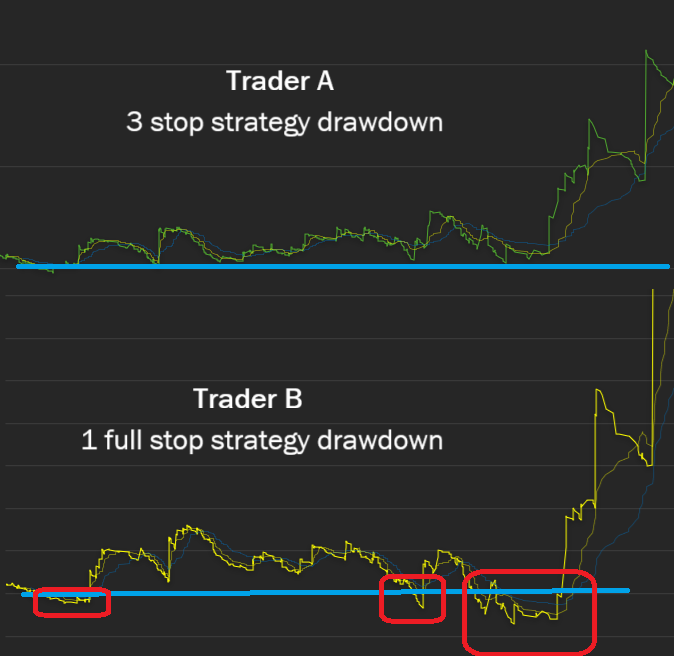
I developed the 3-stop strategy prior to the T+3 framework — it’s since been widely adopted, including by several quant funds.
3) An Example with My ITA Trade in November 2024

4) Another example with RDDT from 5th June 2024
5) Spreadsheet Template Of Columns and Formula Required
6) My Sizing Methodology For Re-Entries, Still Keeping R Loss Within -1R
7) Graphical display done by @RomanBreakouts


8) Another Graphical display done by shrederickson’s Newsletter

9) Further Reduction of R Loss Per Trade, A Viable Strategy For US/EU Timezone Trader
10) 3-Stop Strategy Execution Tool on IBKR developed by @traderwillhu
12) If You Designed Exit Rules That Lift Your Average R, You’ve Built Yourself A Printing Machine
14) Further Research and Exploration of 3-Stop Strategy by BigWaveChartist
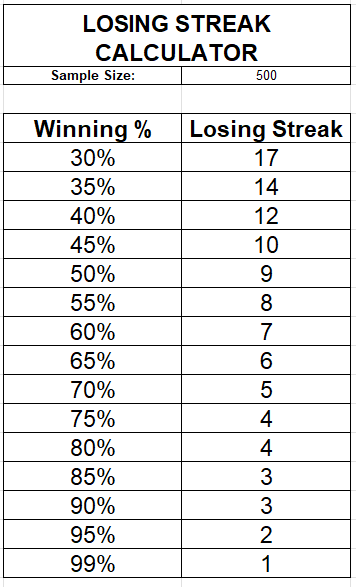
15) Imagine the approach with reduction in impact on equity with 10 consecutive losing trades
i) Example with HIMS, CBAY, ONON, MBLY in April 2023
17) 3-Stop Strategy Will Not Interfere The Trade/Intended Stop Loss Level
18) Shoutout from @LoneStockTrader for 3-Stop Strategy

Credits: Jose Garcia - @lowerhighpivots Some Tools, Additional Resources, and Evidence/Research
1) I use price alerts, simple position sizing spreadsheet to market/buy stop execution
2) What do I look for upon price alert from Focus List
3) One trade to more than cover 13 losing streaks is my style
4) He did one winning trade that covered 50 over losses
5) pedma did a deep dive of my execution edge. I highly recommend to do investigative work like this on your own trading.
6) I will never chase a trade after I missed the most optimum entry. A case of PSIX
7) This is my live market main frame
8) This is how Quallamaggie’s RGTI trade on 9th September 2025 gain beyond +40-80R
9) How you manage your relationship with Stops will define your success


PS: “the best loser is the long-term winner” - Phantom of the Pits
Chapter 7. Post Execution - Trade Management of Stops Adjustment, Partial Profit Taking, and Closing Position
Don’t get fixated on price movements; be patient with the factor of time. Remember, a chart has both a y-axis and an x-axis.
Kyna Kosling put together an excellent write-up on my risk and position management philosophy that I’ve shared over time on Twitter. If may refer to the direct access below;

Why Certain Quallamaggie Rules Stand The Test Of Time As Golden
The Only Way To Consistently Finish Positive YoY With A 35% Win Rate
PS: You performance growth depends on managing existing trades well, not just seeking new ones.
If you don’t sell into strength, you’ll end up selling into weakness.
Chapter 8. Journaling, Investigating, Fine Tuning to Improve Your YoY % Performance
Trading is a long-term growth game, too many approach it as a short-term income generator.

Trading As A Big Data Game Controlled By You
1) Profitable trading is not about opinions, or single great stock pick. It is about math.
2) The greatest improvements in trading performance will come from analyzing yourself.
3) And has to begin with reducing Randomness,
4) Consistency in these Habits will help to reduce Randomness
8) A More Mellow Approach Of 27% Win Rate to an Annualized Gain Of 114%
A Period Review Process is Non-Negotiable to Remain Profitable
What Do I Monitor In My Journal - (Part 7) You Should Know Your Quantifiable Edge Now
If You Accepted <50% Win Rate, Setups Are Secondary & Will Never Be Groundbreaking
Handling A Drawdown - I Suffered 3 Successive Months Of Drawdown In 2022

Chapter 9. With experience and your own trading stats, internalizing these 6 graphics will give you remarkable trading conviction.

I want you to truly internalize these 6 graphics, and their relationship to each other. They are intertwined and may offer you a new perspective, understanding, and belief that reshapes how to tune your current trading performance. Below graphics with links are the expanded discussions. I highly urge you to go through all the comments and replies, they are high quality discussions you don’t get from a trading course or service:
Executing Trade At A Much Tighter Risk Has A Parabolical Effect With R Returns - Marios Stamatoudis

A Comparative Simple Monte Carlo Simulation Based On 500 Trades (vs 50% Tighter Entres)

Know Deeply What A Drawdown On Your System Will Look Like - Foreword byMichael Nauss CMT

The higher the return, the larger the absolute increase in R. - Martin Luk & Kyna Kosling

Benefits of High ADR% Securities
6.1 Use This As A Capital Requirement Reference Guide Relative To ADR%
6.2 Limitation of 1% Risk To Equity

A Trading Strategy May Offer +EV Over Time, But Trading Edge Does Not Stem From The Strategy Alone.


- Quallamaggie 8/8/2017, after he bought a boat in the past weeks
Chapter 10. So, What does it take to go Full Time Trading? Lots of Hard Truth
Chapter 11. Five Books I Highly Recommend To Strengthen Your Foundation. You do not know what you don’t know.

You may not have come across some of this books
Chapter 12. Free Productivity Tools, Resources, and Websites I Rely On
A More Extensive Free Productivity Hack If Are A Investor On Twitter (X)
Additional Top 9 Free Investing & Trading Web Tools (2024 Version)
25 Free Tools And Website You May Not Heard Of (2024 Version)
5.1 I use it to analyze Stanley Druckenmiller’s quarterly F-13 filing positions.
A collection of my Tradingview threads on hacks, indicators, templates, screening (2024 Version)
I Highly Recommend This 8 Free Tradingview Public Scripts (2024 Version)
I Really Like FinanceCharts.com, And The Best Part, It’s Completely Free.
Chapter 13. I Delayed My Own Progress by 3 Years Learning the Wrong Things: Refine Your Twitter Feed By Following These Legitimate Traders Who Share With Real “Trading Maturity” Without Selling.

My Top 5 Highlights and Discoveries in Fintwit (2024 Version)
Outstanding List Of Chart-Focused Accounts, Categorized By Expertise. Use their sharing to compare with yours. (2024 Version)
BrianLeeTrades Is One of My Favorite Follow On Twitter
1) BrianLeeTrades did another AMA with over 100 replies
2) My Summary Of BrianLeeTrades 2024 Interview
3) BrianLeeTrades’s ‘Are You Getting Greedy?’ Twitter Space (January 2024)
LoneStockTrader Is One Of My Favorite Follow On Twitter
1) LoneStockTrader may have solved M1/M5 ORB strategy required precision
Clement Ang Is One of My Favorite Follow On Twitter For His Daily Top-Down Commentary. It is easy to read while being clear and time-efficient.
PS: The list will expand over time.
Chapter 14. High-Impression Twitter Posts Of My Personal Deeper Thoughts and Experiences for You to Relate To

I Missed A +300K USD Trade After Engaging With 5 Stops Losses
You Don’t Need To Come From A Privileged Family To 'Make It’'
Good Investors Don’t Sell Investment Advice. Good Traders Don’t Sell Services.
You Relationship With Uncertainties Determines Your Performance - How to Embrace Risk
Bitten By A Snake, Focus On Healing and Not Chasing It For Reason
If You Work Diligently and Intelligently, You Can Certainly Excel Beyond The Average
My Advice: If You Have Good Career, With Prospect For Growth
My Advice: Vulnerable Groups I Believe Trading Isn’t Suited For, Even With Significant Capital.
Everyone Wants To Win Until They Realize How Many Losses It Takes
The Right Mindset - My Adjustment In The Last 12 Years (2022)
Procrastination Will Delay Your Success. Dedication Is Non-Negotiable.
You Can Control Your Actions, You Can’t Control The Outcome.
The Urge To Give Up Is Often Strongest Right Before You’re About To Succeed
Longevity To A Trading Career Requires Solid Daily Routine. This Is Non-Negotiable
The Crucial Thing Is To Avoid Playing When You Don’t See A Fat Pitch.
Avoid Trading Under Misconception Everyone Achieves Success In Trading
Trading Is About Grinding Your Mathematical Edge and Maintaining Grit.
PS: If You Have Amassed Wealth, You Have the Ability to Help Less Fortunate


Chapter 15. Closing Remarks – A Call to Inspiration

If I could inspire you to commit three years to this pursuit, know that my 2023 total tax bill exceeded 100k USD despite no capital gains tax in Singapore. It can be life-changing, but success requires grit, right tools, knowledge, and a mathematical edge built from your own trading.
This was my mindset 12 years ago — and it couldn’t have been more wrong. Don’t be like me.
BONUS: This is Quallamaggie’s 2013 to 2024 tax returns
Chapter 16. Additional Information & FAQ
Key Annual Market Dates to Know
Options Expiration:
Occurs on the third Friday of every month (for standard monthly options).Rebalancing Activities:
Quarter-End Fund & ETF Rebalancing: Typically occurs around the last few days of each quarter (March, June, September, December).
Annual Fund & ETF Rebalancing: Often done at year-end (around December 31).
Index Reconstitutions:
S&P 500 (SPX): Adjustments generally align with the third Friday of each quarter, coinciding with index futures expiration (“triple witching”).
Russell 2000 (IWM): Major reconstitution takes place on the fourth Friday of June each year.
MSCI Index Rebalancing: Happens semiannually, in May and November.
FTSE Index Rebalancing: Occurs quarterly — in March, June, September, and December.
FAQs paired with thought-provoking questions

A Condensed Infographic by @SobkoYaroslav
“How long did it take you to become consistently profitable trader?”
“How would you summarize the philosophy behind your trading?
“In an active session, what’s your typical number of trades or R?”
“With RVOL, I’m noticing that entries often aren’t optimal anymore. How do you handle this?”
“Do you take into account the level of short interest when deciding whether to long/short?”
“What are the sectors excluded in your Tradingview & Finviz filter?”
“Do you consider sector ATR extension when putting on risk? For example, XLK approaching >5.”
“What does a ‘stalk list’ name need to do to qualify as an actionable idea on your Focus list?”
PS: The list will grow over time as further compilation is completed.
